The basic library of approximate circuits v1.1
CIRCUITS AND THEIR PARAMETERS
The EvoApproxLibLITE is the lightweight version of our library of approximate circuits with formally guaranteed error parameters. Hardware as well as software models are provided for each circuit.
Reported error parameters: MAE - Mean Absolute Error (Mean Error Magnitude), WCE - Worst-Case Absolute Error (Error Magnitude / Error Significance), MSE - Mean Squared Error, MRE - Mean Relative Error (Mean Relative Error Distance), WCRE - Worst-Case Relative Error, EP - Error Probability (Error Rate) | Reported design parameters: power - power consumption in mW, area - area on the chip in um2, dly - delay, all values obtained using Synopsys DC (45 nm PDK, 1 V, 25 ℃) | Error parameters marked by were verified using a formal technique analyzing all possible input combinations. There is a formal guarantee that the error is not worse than the shown value. The exact values are included at the beginning of each C file and Verilog file.
COMPARISON
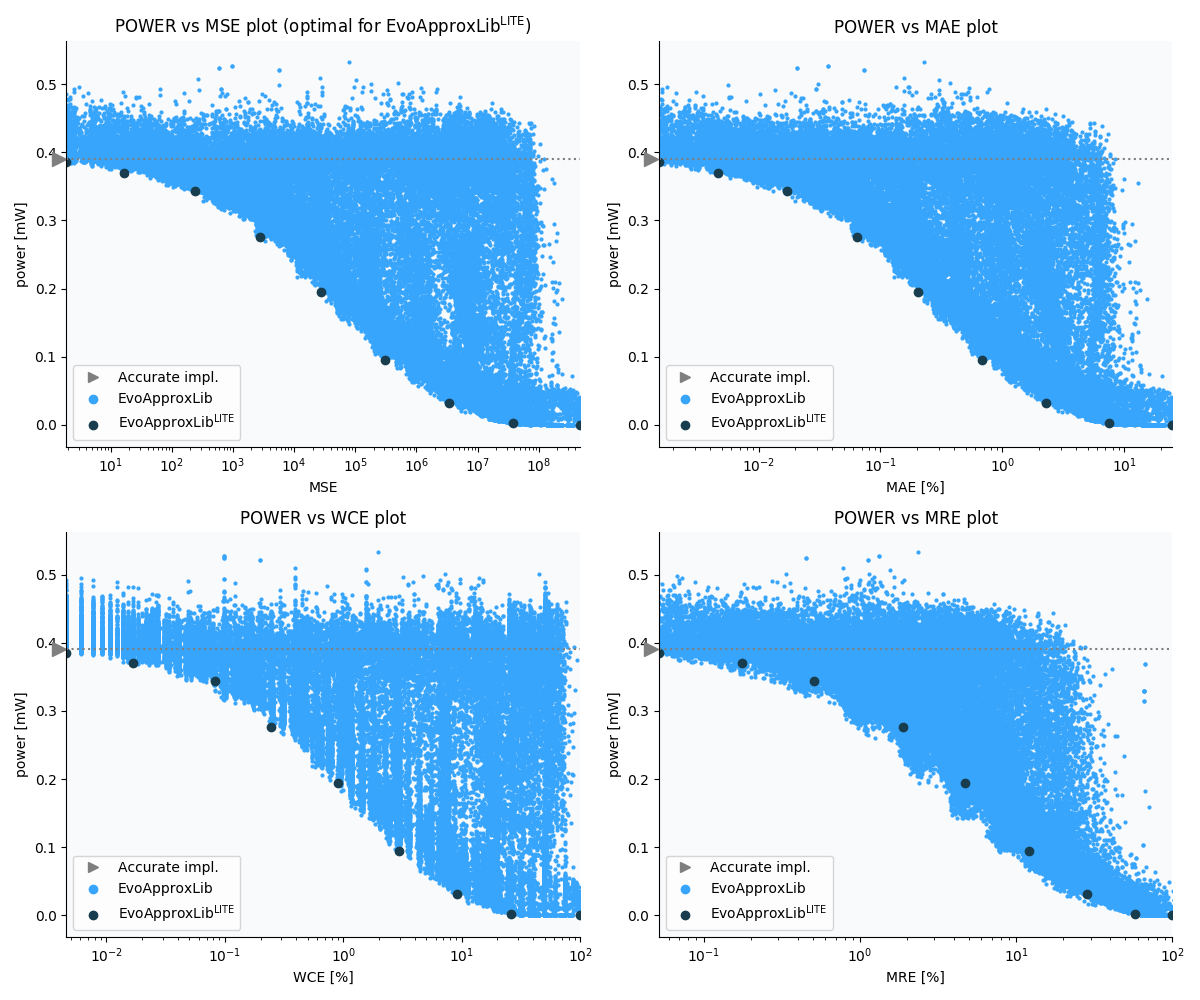
Comparison with the complete EvoApproxLib dataset on various metrics. The first plot shows the performance wrt. the parameters used for pareto filtration. The black dots are the circuits included in this dataset. The blue dots are parameters of the circuits included in the full version of EvoApproxLib. Note that the parameters of the accurate implementation shown in the figure correspond with those exhibiting the lowest power consumption.